

Note: Monitoring helps you track how efficiently your jobs use resources. Use it to optimize performance and avoid wasting compute time.
Quick Reference Summary
For quick checks:
- Use
squeue -u <netid>to see your running jobs - Use
seff <jobid>to check efficiency of completed jobs - Use
/gpfs/software/hpc_tools/get_resource_usage.pyfor script-based summaries
For detailed real-time monitoring:
- Find your node with
squeue -u <netid> - SSH into the node:
ssh <nodename> - Use
glances(most comprehensive),htop(detailed), ortop(basic)
For optimization:
- Monitor CPU load values (should match core count for full utilization)
- Check memory usage to avoid over-requesting resources
- Consider shared queues for jobs that don't need full node resources
- Adjust job scripts based on actual usage patterns
Introduction
Efficient resource utilization is essential for the effective use of our computing infrastructure on SeaWulf. This guide outlines several tools and scripts available for tracking Slurm job resource consumption. By using these tools, you can ensure your jobs are running efficiently, thereby helping to conserve resources and improve overall system performance.
Understanding CPU Load
An important aspect of optimization is understanding CPU load, which represents the average number of processes trying to use the CPU over a specified time interval. For example, on a fully utilized 40-core node, you would expect the load to be around 40. A significantly lower load might indicate underutilization of resources, while a much higher load likely points to oversubscription, potentially degrading code performance.
The CPU Load statistic is typically given as three values. These are the average sum of the number of processes waiting in the run-queue plus those currently executing over 1, 5, and 15-minute time periods respectively. By monitoring and adjusting CPU load, you can maintain optimal job efficiency and prevent performance bottlenecks, further enhancing resource utilization.
Common Monitoring Commands
Before diving into detailed tools, here are quick commands to check job status and efficiency:
| Command | Purpose | Example |
|---|---|---|
squeue -u <netid> |
List your running and pending jobs | squeue -u sam123 |
sacct -j <jobid> -l |
Show detailed stats about a completed or running job | sacct -j 123456 -l |
seff <jobid> |
See efficiency (CPU, memory) of completed jobs | seff 123456 |
ssh <node> |
Log into allocated node to run real-time tools | ssh dn045 |
Monitoring Tools
get_resource_usage.py
The get_resource_usage.py script is a tool designed to help users monitor the resource usage of their Slurm jobs on SeaWulf. It provides a concise summary of CPU and memory utilization, making it easier to identify inefficiencies and optimize resource usage.
Script Location:
/gpfs/software/hpc_tools/get_resource_usage.py
Basic Usage:
For most users, running the script without arguments will provide all necessary information:
/gpfs/software/hpc_tools/get_resource_usage.py
Command-Line Options:
The script comes with several options to tailor the output to your needs:
/gpfs/software/hpc_tools/get_resource_usage.py --help
Available options:
-h, --help- Show help message and exit-u USER, --user USER- Only report usage for this user-l LOW, --low LOW- Only report nodes with % CPU usage lower than this value-e HIGH, --high HIGH- Only report nodes with % CPU usage higher than this value-n NODE, --node NODE- Only report usage on this node-j JOB, --job JOB- Only report usage for this job ID
Example Output:

In a typical example, you might see output showing one Intel Skylake 40-core node allocated, utilizing less than 26.5% of the CPU with a CPU load of 10.58, and memory usage at a meager 14.2%. This output would suggest an inefficient use of the compute node, indicating that resources could be better optimized.
Real-Time Monitoring via SSH
To see live CPU and memory usage, you need to identify your job's node with squeue and SSH into it. These tools provide thorough insights into CPU and memory usage, which is crucial for keeping an eye on performance and making necessary optimizations.
Accessing Your Compute Node:
squeue -u <netid>
This command displays a list of your active jobs (assuming the Slurm module is loaded). The output shows job information including the node name where your job is running:
JOBID PARTITION     NAME     USER ST       TIME  NODES NODELIST(REASON)
485898 short-40c     bash ssperrot  R       0:23      1 dn045
Once you identify the node, SSH into it:
ssh dn045
By directly accessing the nodes your jobs are currently running on via SSH, you can get instant updates on resource allocation, spot any potential bottlenecks, and address them promptly to improve efficiency. This lets you monitor usage dynamically, for example, checking RES (resident memory) in top.
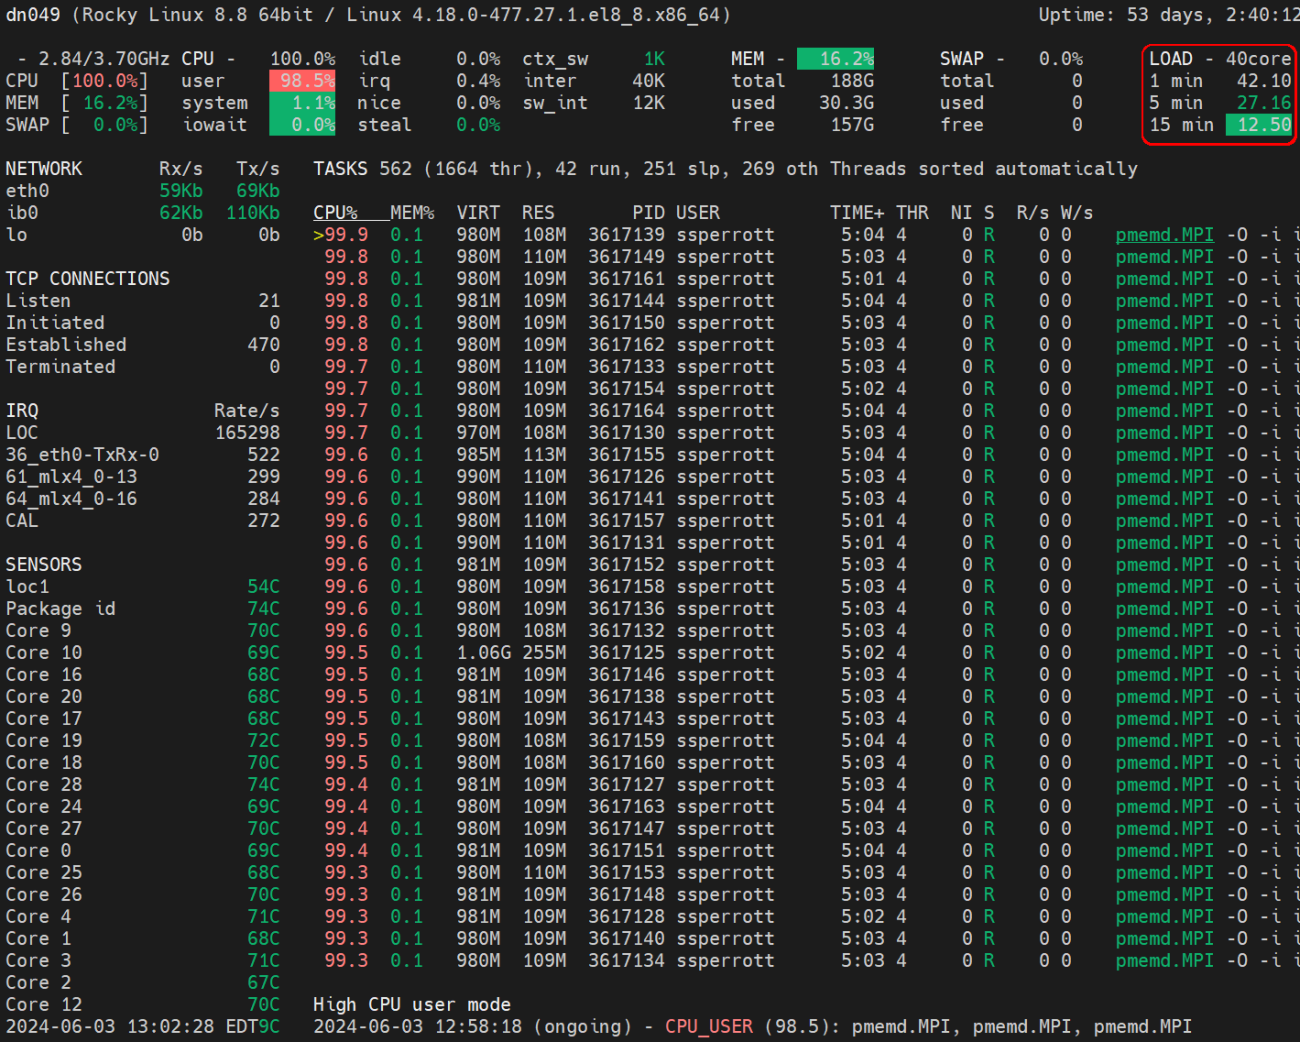
glances
glances is, in most cases, the best tool for real-time system resource monitoring on SeaWulf. It offers a detailed interface with comprehensive system resource monitoring capabilities, making it an attractive choice for users who prefer straightforward yet powerful tools. It helps in the identification of resource-intensive processes and system bottlenecks, facilitating effective troubleshooting.
Using glances:
After SSH-ing into your compute node, load the module:
module load glances
Then execute the command:
glances
What to Look For:
Using the glances command, you can easily spot inefficiencies in resource allocation such as certain processes monopolizing CPU resources or excessive memory usage, indicating potential optimization opportunities. When properly configured, you should see optimal resource utilization across the node.
Additionally, glances offers built-in plugins that provide additional functionalities such as network and disk I/O monitoring, expanding its utility beyond basic system resource tracking. This versatility enhances its effectiveness in providing a comprehensive overview of CPU, memory, and process data, aiding in efficient system performance analysis.
Read the glances documentation for more information on the available features.
htop
The htop command has been a reliable tool for monitoring real-time system resource usage on SeaWulf for many years. It offers a comprehensive display of CPU, memory, and process data, providing a detailed insight into system performance.
Using htop:
After SSH-ing into your compute node, load the module:
module load htop
Then execute the command:
htop
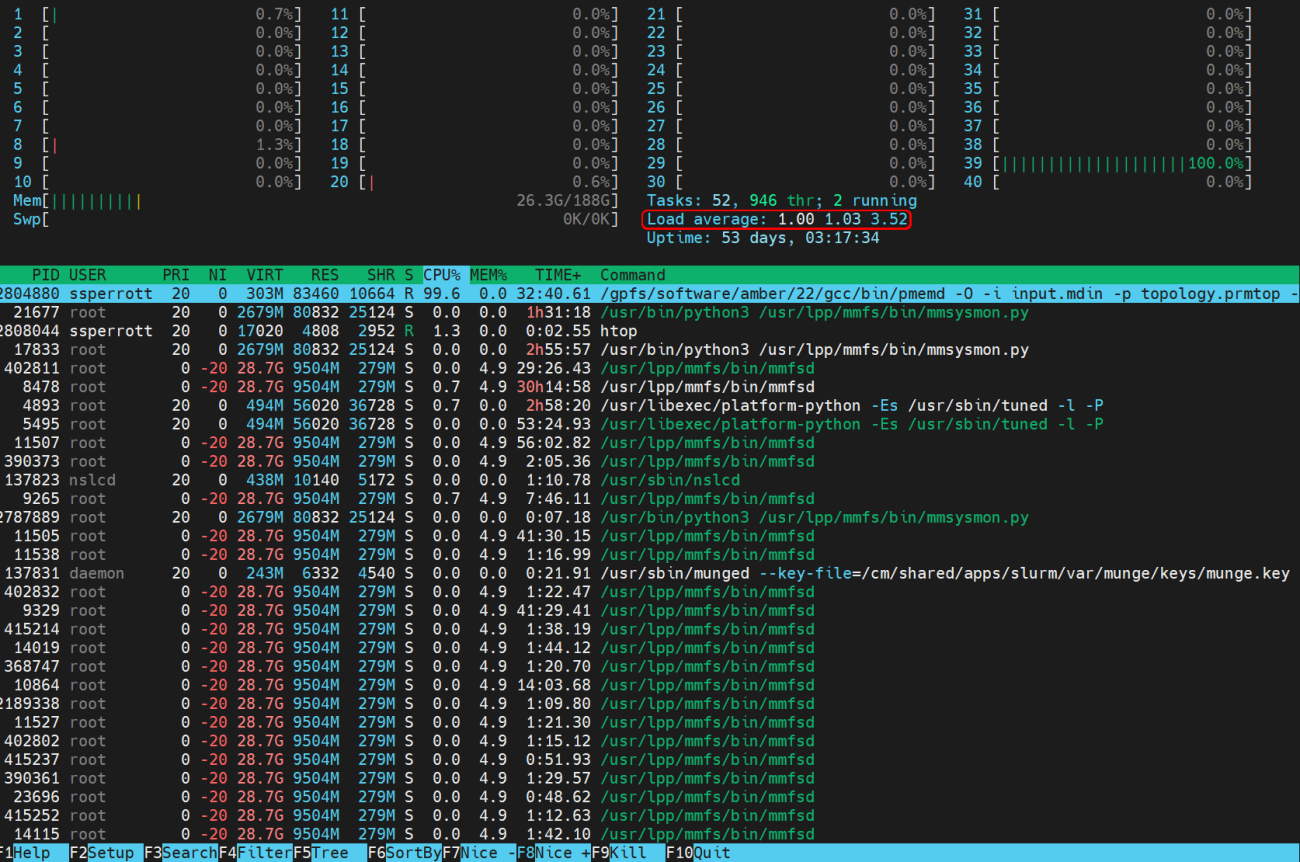
Identifying Inefficiencies:
Using htop, you can readily identify inefficiencies in resource utilization. For example, if you observe a program like Amber's pmemd command occupying only a single core on a multi-core node, this highlights inefficient utilization of the computing node, leading to sub-optimal performance.
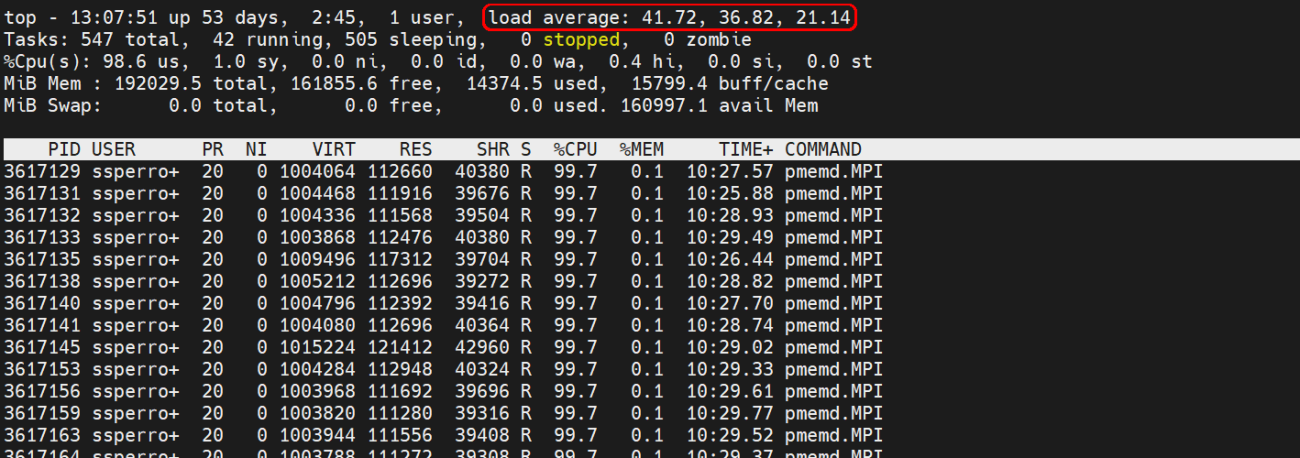
Observing Efficient Usage:
Conversely, htop will also help you observe programs efficiently employing MPI to distribute tasks across 40 concurrent processes, fully utilizing all available CPU cores on the node for optimal performance.
Read the htop documentation for more information on the available features.
top
If you only need a subset of the features outlined by the previous tools, the top command serves as a fundamental tool to monitor real-time system resource usage on SeaWulf. It presents a clear overview of CPU, memory, and process data, allowing users to detect anomalies or resource-intensive processes without requiring additional modules.
Using top:
After SSH-ing into your compute node, simply run:
top
This command requires no additional module loading and provides basic but essential monitoring capabilities.
Read the top documentation for more information on the available features.
Optimizing Resource Usage
We hope you'll make use of these tools to ensure your jobs are efficiently utilizing the resources you've requested. If you find any discrepancies or inefficiencies, don't hesitate to take action to improve your resource usage. This could involve:
- Refining your job configurations
- Adjusting resource requests based on observed usage
- Optimizing your code to better match the allocated resources
If you encounter any challenges or need guidance in enhancing your resource efficiency, our support team is here to assist you every step of the way.
Click here to submit a ticket to the HPC support site
Shared Queues
Lastly, we want to highlight that if you find that your job doesn't need all or most of the resources on a node, we encourage you to utilize the "shared" queues. These queues allow for more efficient resource allocation by enabling multiple jobs to run simultaneously on the same node, maximizing resource utilization. For more information on how to use the "shared" queues and optimize your job submissions, please refer to our comprehensive FAQ article, where you'll find detailed guidance and instructions.